Is it possible that the 80/20 rule can apply to every area of life—including how you spend money?
If you’re unfamiliar with the 80/20 rule, here’s a quick definition:
- “The Pareto principle (also known as the 80/20 rule, the law of the vital few, or the principle of factor sparsity) states that, for many events, roughly 80% of the effects come from 20% of the causes.”¹
I’ve mostly heard of the 80/20 rule applied to business and work:
- 80% of your revenue comes from 20% of your customers,
- 80% of your results come from 20% of your work,
- etc
Naturally, I wondered if the same rule applies to personal finances and how the average American spends money.

The 80/20 Rule for Money: The 3 Ways Americans Spend Most of Their Money (& How You Can Save More)
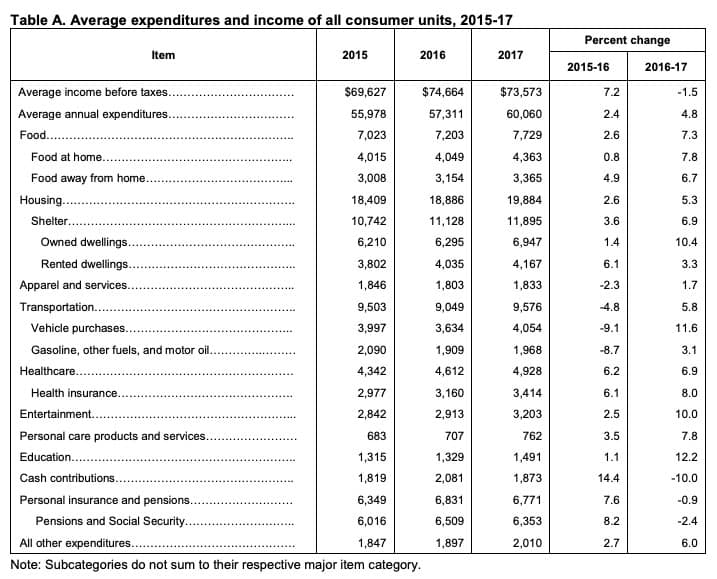
The US Department of Labor’s Bureau of Labor Statistics (BLS) published their latest release of consumer expenditure data in September 2018. The survey looks at spending by “consumer unit” which is defined as:
- “Consumer units include families, single persons living alone or sharing a household with others but who are financially independent, or two or more persons living together who share major expenses.”²
But, what I find more interesting than the total amount is where all that money is spent. The three largest spending categories are:
- Housing: $19,884 (33% of the total $60,060)
- Transportation: $9,576 (16%)
- Food: $7,729 (13%)
That is $37,189 from those three categories alone—62% of total spending.
The report shows 11 spending categories, which means 3 account for 27% of the total categories. It’s not quite the 80/20 rule, but it’s pretty darn close:
These three spending categories are the three highest regardless of your type of household. The only thing that changes when you dig in deeper by type of consumer unit is the percent spent in each category—the totals range from 58%-67%:

A Brief History of American Money Spending since 1901
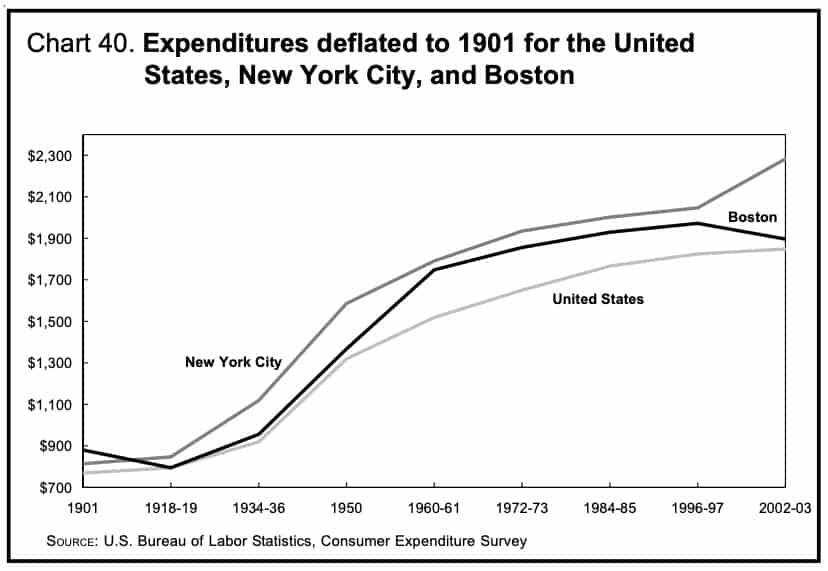
Believe it or not, some amount of consumer expenditure tracking has occurred for over 100 years. About the length of time the phrase “keeping up with the Joneses” has been in existence. And, there are some BIG differences between how we spent money back then compared to how we spend money today.
Here are some highlights from the BLS report 100 Years of U.S. Consumer Spending³ that was published in 2006:
- “In 1901, the average U.S. family had $769 in expenditures. By 2002–03, that family’s expenditures would have risen to $1,848, a 2.4-fold increase.”

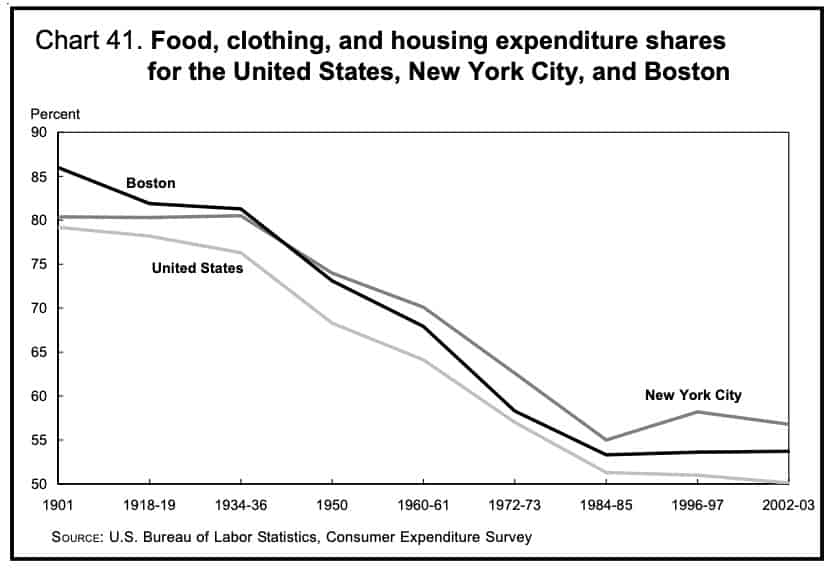
- “(In 1901) 42.5% ($327) was allocated for food, 14.0% ($108) for clothing, and 23.3% ($179) for housing. That left $155 for all other items.”
Wondering when housing became the #1 spending category by Americans?
- “With greater home ownership and higher housing costs, in the 1960s family spending for housing became the most significant item in household budgets, displacing spending on food.”

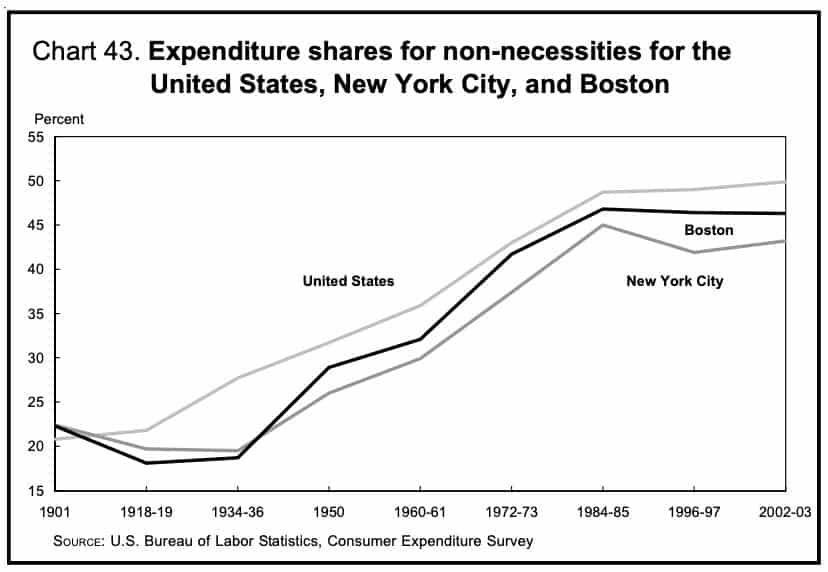
- “In 2002–03, the average U.S. family could allocate 49.9% ($20,333) of total expenditures for a variety of discretionary consumer goods and services, while the average family in 1901 could allocate only 20.2%, or $155, for discretionary spending.”

Bonus: Where does all the non-necessity spending go? How about Funyons, cosmetic surgery, and getting drunk?
How You Can Save More Money
I recently completed a buy nothing year for clothing (and am still going!). There are a lot of positives to doing a buy nothing year: decluttering, voluntary simplicity, getting closer to minimalism, reducing waste on the planet, and much more.
By the name alone (“no spend,” “buy nothing,” etc), you likely associate these challenges with saving money. But, depending on the category or categories you choose to stop spending in, you may not save much. For me, clothing is simply too small of a category to make a meaningful dent in our overall finances.
So, only buying the essentials is a start, but how can you really save more money?
How does your spending compare to the data? If you don’t know, I highly recommend tracking your finances for at least a few years to understand how you spend your money and analyze your own personal trends over time. Data can be your friend and a helpful tool when it comes to your finances.
If you want to compare your spending to the averages in each category, here you go:

One Final Thought
The 100 Years of U.S. Consumer Spending report ends with the following conclusion:
- “Perhaps as revealing as the shift in consumer expenditure shares over the past 100 years is the wide variety of consumer items that had not been invented during the early decades of the 20th century but are commonplace today. In the 21st century, households throughout the country have purchased computers, televisions, iPods, DVD players, vacation homes, boats, planes, and recreational vehicles. They have sent their children to summer camps; contributed to retirement and pension funds; attended theatrical and musical performances and sporting events; joined health, country, and yacht clubs; and taken domestic and foreign vacation excursions. These items, which were unknown and undreamt of a century ago, are tangible proof that U.S. households today enjoy a higher standard of living.”
Is this really the measure of a high standard of living? Or, is this just a summary of the multitude of ways we’ve veered off course to convince ourselves that more things and experiences are the key to happiness? What does all the lifestyle inflation and spending on non-necessities really do for us?
Don’t forget that you can choose a simple life at any time—you can choose to be the fisherman instead of the tourist.
Sources:
- https://en.wikipedia.org/wiki/Pareto_principle
- https://www.bls.gov/news.release/pdf/cesan.pdf
- https://www.bls.gov/opub/100-years-of-u-s-consumer-spending.pdf


